CloudProxy WAF – September Report
*By Tony Perez and Daniel Cid
As many of you are aware we released a website protection tool (WAF+IDS) at the beginning of the year and over the months we have been working with the data we’ve been accumulating. We’re finally at a place where we think we can provide better insight into the world of website attacks. What we’re hoping to do is provide a monthly summary, similar to what you’ll read here that helps you understand the various website attacks we can see via our CloudProxy WAF. It will also, hopefully, shed insight into the growing online threats that website owners face daily.
September 2013
We have some very small and some big sites with us. And the first thing we noticed is that even the smaller sites get attacked quite often. All sites do.
Every web site gets attacked. And that happens daily. Many times per day.
For the purpose of this report we’re going to break this into two high-level attack cateogires – Denial of Service (DOS) and Web Attacks. Although DOS attacks are a form of web attack to better understand and normalize the data it’s best we segment the information out, you’ll see why in the chart below:
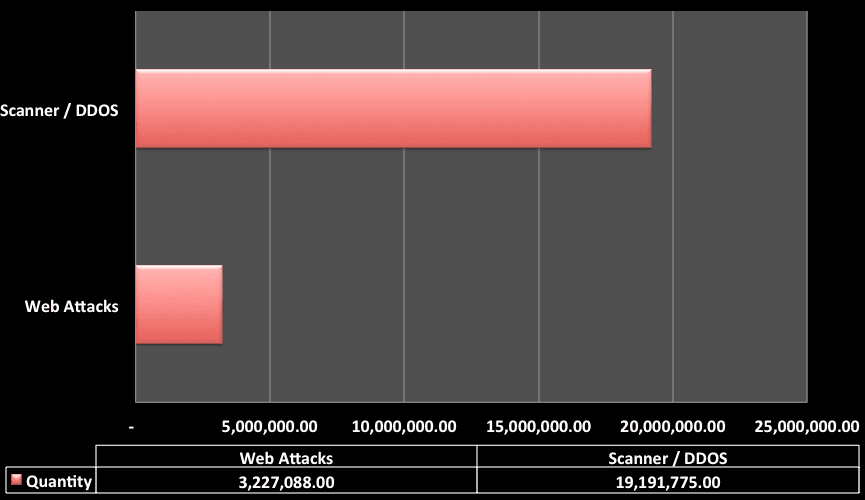
In this chart we see a total of 22,418,863.00 attacks were blocked via the CloudProxy. Interestingly enough, 85%, 19,1191,775, of those attacks were layer 7 DDoS, DoS / High frequency scanner type attacks. Note that we are talking about layer 7/HTTP denial of service, not the ones targeting lower layers. Of the 3 million or so attacks the distribution was as follows, based on our internal classification of attacks:
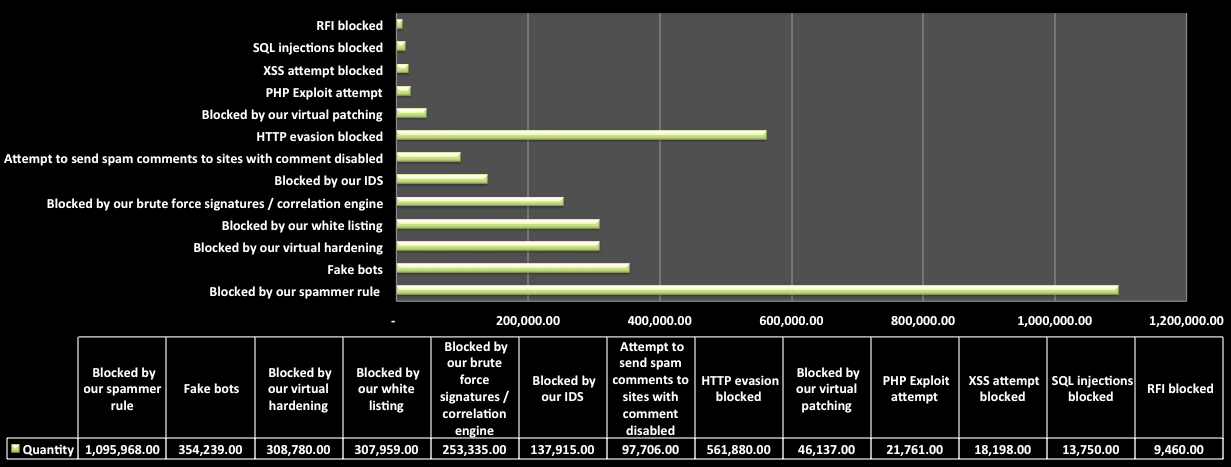
Interestingly enough, one of the biggest attacks we block are spammers, this includes those individuals trying to leave “buy me” comments on your posts to attackers that are trying to register to your site via registration forms and other similar access points.
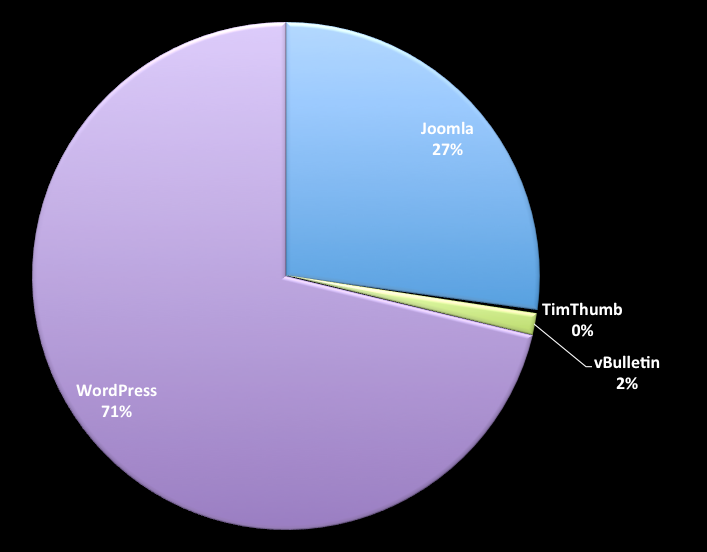
The other very obvious question we found ourselves asking is, “Which platforms appear to be the biggest targets?” Trying to answer this question we came across this distribution of attacks, granted, there will obviously be margin of error here and we don’t have enough data over a longer period to provide a more representative example, but it’s interesting enough none the less.
Those are some of the direct URL’s where most attacks happened:
#of hits – URL – Classification
876,364 /wp-login.php – WordPress wp-login attempts
352,481 /administrator/index.php (Joomla admin page)
231,782 /wp-comments-post.php (WordPress comment page)
51,755 /administrator/index.php?option=com_login (Joomla admin page login)
17,039 /images/stories/random.php (Joomla backdoor and exploitation attempts)
13,112 /wp-login.php?action=register (WordPress registration page)
11,257 /login.php?do=login (vBulletin login page)
10,312 /register.php?do=addmember (vBulletin registration page)
5,831 /index.php?option=com_jce&task=plugin&plugin=imgmanager (Joomla file manager exploit attempt)
3,696 Timthumb (Timthumb exploit attempts)
Note that attacks against those URLs can be filled under different detection categories, since an attempt to wp-login can be under a DDoS, under a bot or even under the spammer or admin panel white listing.
What is interesting is that we can see the same attacker scanning different sites under our protection and looking for the same type of vulnerabilities.
And it shows what we have been saying to our clients that everyone is a target. Not because someone is really targeting you directly, but because most attacks are targeting a specific vulnerability or platform (or even IP range). IF your site falls into their target category, it will be probed.
One example is the latest Joomla vulnerability. Once it was released, attackers started scanning the whole Internet (and using Google dorks) to find sites that could be vulnerable to it. So they don’t care much which web sites they are going after, they only care weather they are vulnerable or not.
The very last piece of data we found very interesting was the source of the attacks. Looking at the attacks holistically this was the geographic distribution of the attacks by country.
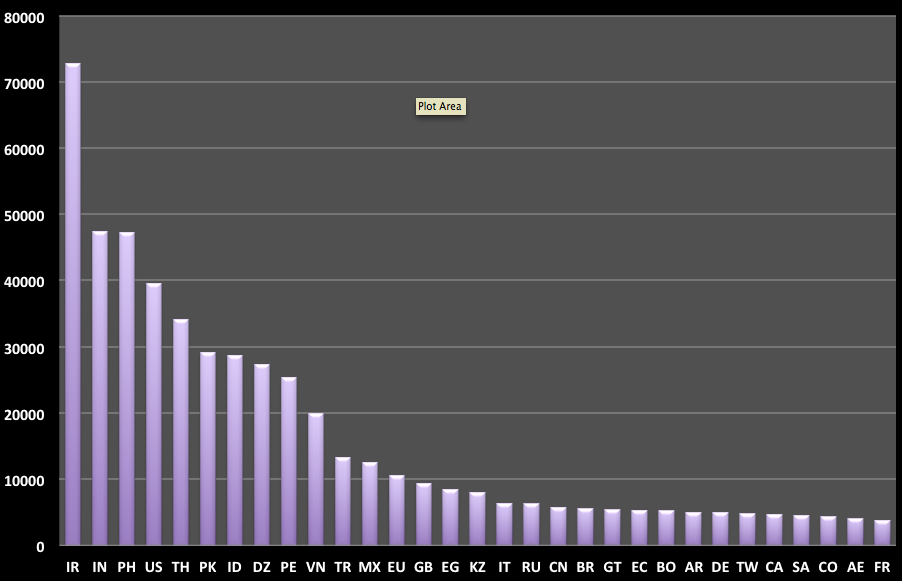
Iran was very busy and the source of most attacks. However, when going down in the data, we saw that it was used mostly on some of the layer 7 DDoS attacks we were blocking.
Those were the top 10 attacker IP addresses for the month in terms of hits:
151752 188.165.243.45#FR
43091 46.118.159.187#UA
37487 178.137.18.199#UA
33296 46.118.115.0#UA
31165 46.118.152.65#UA
27758 188.65.117.67#GB
20737 142.4.211.151#CA
20063 95.165.160.85#RU
18129 108.216.108.136#US
17019 95.37.216.28#RU
Reflecting
This is our first month sharing our data, but we plan to do that every month. Hopefully, with more actionable information to help everyone.
If you have ideas or recommendations for data we should try to include and / or capture please do let us know. We would love to hear them.
Read more: CloudProxy WAF – September Report